Why and how did we develop the Push-out Score™?
When a top manager leaves the position, a crucial question arises:
Is it a forced or a voluntary departure?
The answer can be difficult. C-suite executives are rarely openly fired. And the problem starts with the definition of “forced” and “voluntary.”
Is it a voluntary departure when the CEO, according to the corporate announcement, “provided notice to the Company that he will voluntarily retire,” whereas there is strong reason to believe that the manager took advantage of the opportunity to resign before being pushed out in disgrace?
The difficulty is that both the company (namely, the board) and the executive in question have motives not to reveal forced turnovers as such. Board and management are, within certain limits, not necessarily required to reveal the reason for a departure. Therefore, they will defend their own interests.
The result is unsatisfactory for many stakeholders of the company, including investors, creditors, customers, employees and the public. They need to know what happened. And they have legitimate interests in learning what is going on. It also affects them.
“People familiar with the matter” and “people familiar with the board’s thinking” may give additional (and alternative) facts or complex answers to simple questions to influence media coverage. They may provide valuable information. But anonymous sources that cannot be held liable for their statements must be considered with caution. They are not primarily committed to the truth. First and foremost, they follow their own (or their clients’) interest and may be inclined to give biased information.
For academic researchers, a common categorization procedure is to use some variant of the Parrino (1997) algorithm to classify CEO turnover. This rule-based method allows a relatively rough classification: voluntary or forced. The risk of misclassification is relatively high.
Some years ago, Daniel Schauber, a veteran financial journalist, started a research project to determine whether a new approach, inspired by the push and pull factors theory in migration research, would prove more fruitful.
The central question of the research project was:
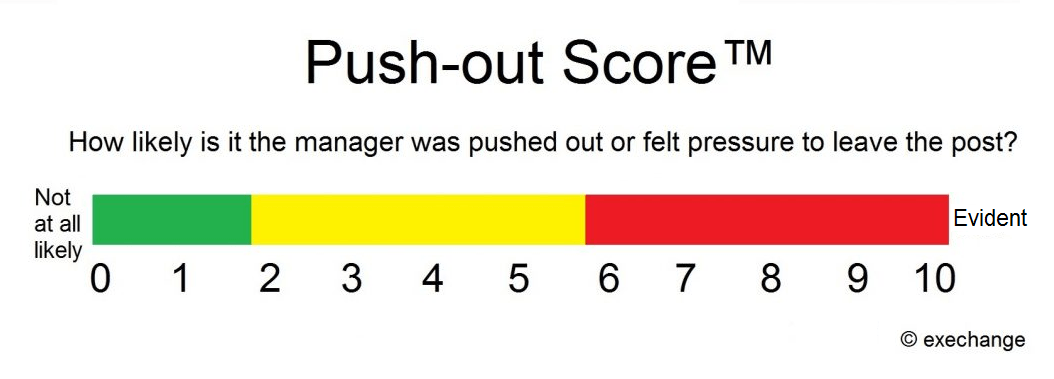
On a scale of 0 to 10, how likely is it the manager was pushed out or felt pressure to leave the post?
The Push-out Score™ would give the answer.
The Push-out Score was developed in an inductive way and in close interaction with experts — among them personnel professionals, executive search firms, investors and corporate governance experts. To develop the Push-out Score, we used a text corpus containing thousands of management-change announcements and regulatory filings from the previous 10 years.
Ultimately, nine criteria turned out to be particularly suitable to determine the likelihood of a forced turnover:
- Form of the management-change announcement
- Language in the announcement
- Age of the departing executive
- Notice period (time between announcement and departure)
- Tenure
- Share price development
- Official reason given
- Circumstances of the management change (e.g., firm and industry performance, peer group performance, severance payment),
- Succession (e.g., external vs. internal, permanent vs. interim solution).
The algorithm-controlled model was introduced in 2016 on the website exechange.com and quickly gained attention in the United States and the United Kingdom.
Corporate governance experts from Stanford University (David Larcker and Brian Tayan) and Harvard University (Ian Gow) have investigated exechange’s analysis model and found that Push-out Scores are positively correlated with stock market volatility. See https://www.gsb.stanford.edu/faculty-research/working-papers/retired-or-fired-how-can-investors-tell-if-ceo-was-pressured-leave/
“[A] company’s stock price volatility increases with increasing Push-out Score. That is, investors react in a fairly muted fashion to CEO and CFO departures that receive a low Push-out Score but react more dramatically — both positively and negatively — as Push-out Score increases,” the researchers wrote and concluded: “A positive reaction might indicate that shareholders approve of a decision to push out the CEO because of the potential for operational improvements or future sale of the company. … On the other hand, a negative reaction to a high Push-out Score situation might indicate that shareholders view a forced termination as evidence of deeper operating, financial, or governance problems, or that shareholders disapprove of the decision to fire the CEO.”
On August 14, 2017, The Wall Street Journal featured the Push-out Score on the front page. See https://www.wsj.com/articles/did-the-ceo-actually-get-fired-theres-a-decoder-for-that-1502645422/
In 2022, David Larcker, Brian Tayan (both of Stanford University) and Edward Watts (of Yale University) analyzed a sample of 1,399 CEO turnover events at Russell 3000 companies over the five-year period 2017 to 2021, including Push-out Scores. The researchers concluded: “We find a high association between stock-price performance and the likelihood that a CEO is pressured to leave. This indicates that Push-Out Scores provide informative assessments of whether a termination event is involuntary. It also indicates that boards might be more likely to hold CEOs accountable for performance than prior studies suggest.” See https://www.gsb.stanford.edu/faculty-research/publications/firing-hiring-ceo-what-does-ceo-turnover-data-tell-us-about/
So how is the Push-out Score actually determined? 10 real, anonymized examples.